

Automate Excel With Python: When you are working on the same dataset, entering the data manually would be extremely time-consuming and boring. To overcome this and save us time, we can simply automate our Excel file with Python. And to automate the XLSX file to Python, one will have to use the openpyxl function. Let us discuss everything about how to pull data from Excel using Python. Read further to find out more.
Python for Automating Excel Data
Data analysis is a very important component of acquiring important insights from your customers. Several firms are experimenting with innovative methods to simplify the data analysis process. Some are attempting to entirely automate this process, while others are utilizing numerous tools to accomplish the same. Another novel approach used by businesses to undertake Data Analysis is to connect their data source to a programming language and have it automate their Data Analysis. Python Excel Automation is one example of this form of automation.
We all know Python rules the world, and we also know Python is beginner-friendly and simple to learn in comparison to other languages. Automation is one of the coolest things you can do with Python.
Real-Life Example
Consider the following scenario: you are required to set up an account on a website for 50,000 employees. What would your reaction be? Doing this task manually and frequently will almost certainly frustrate you. This will also take too much time, which is not a wise idea.
Consider the lives of employees who work in data entry positions. Their role is to insert data from tables like Excel or Google Sheets into other places. They surf various websites and magazines, collect data from them, and then enter it into the database. They must also perform the calculations for the entries.
In general, salary is determined by performance in this job. More entries, bigger income.
But don’t you find it tedious to perform the same thing over and over?
Now the question is, “How fast can we do it?”
How can we make our work more automated?
Instead of executing these kinds of activities by hand, spend an hour scripting and automating them to make your life easier. You can automate a time-consuming activity in Python by writing fewer lines of code.
It will be advantageous if you are already familiar with the fundamental concepts of Python.
Let us now use an Excel sheet with some entries to demonstrate the automated process. Here now we develop a Python code that can process hundreds of spreadsheets in less than a second.
The Main Objective of this Program:
It will take far too long to manually process or update thousands of spreadsheets. It could take hours, days, or months. To automate this task, we will develop Python code.
Here we now work on the spreadsheet shown in the image below:
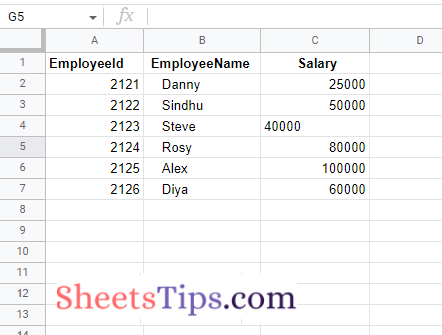
We have records for all kinds of transactions in this spreadsheet, but let’s imagine the EmployeeSalary of the employee indicated in the third column is incorrect owing to an error (human or system error).
Let’s imagine we need to reduce the EmployeeSalary by 10% (multiply the price by 0.9 and recalculate the value). If there are thousands of records, you can complete this operation manually by applying a mathematical formula in the fourth column, but it will take a too long time.
To automate this process, we will now develop a python code. We will also include a chart. This task will be completed in a matter of seconds by our Python Program.
Python Program to Automate an Excel Sheet
Step1: Importing Modules
Here we Import the openpyxl package to work on our spreadsheet. In addition, in order to add a chart to our spreadsheet, we must import the classes BarChart and Reference.
# Import openpyxl module using the import keyword
import openpyxl
# Import BarChart, Reference from chart of openpyxl module using the import keyword
from openpyxl.chart import BarChart, Reference
Step2: Loading the Excel WorkBook
# Pass the excel file path to the load_workbook() function of openpyxl module
# which is the file we want to work with and store it in a variable
workbookObj  = openpyxl.load_workbook('SampleExcelFile.xlsx')
# Access 'Sheet1' from the above workbook object and store it in another variable
worksheet = workbookObj['Sheet1']
Step3: Calculating the salary after tax deduction and Adding it as a 4th Column
# Loop till the number of rows of the worksheet using the for loop
for row in range(2, worksheet.max_row + 1):
  # Get the value of the third cell of the corresponding row using the cell() function
    cell = worksheet.cell(row, 3)
  # Compute the salary after deducting the tax(10%) using mathematic logic and store it in avariable
    salary_after_tax_deduction = float(cell.value) * 0.9

  # Create the 4th column(Net_Salary) to the above worksheet and
  # Store the cell in a variable
    Net_Salary = worksheet.cell(row, 4)
  #  Assigned the modified salary to the above cell
    Net_Salary.value = salary_after_tax_deduction
Step4: Plotting the BarPlot of the Excel Data
# Store the values of the sheet in a variable using the Reference() function
xl_values = Reference(worksheet, min_row=2, max_row=worksheet.max_row, min_col=4, max_col=4)
# Create a BarChart() object and store it in a variable.
chartObj = BarChart()
# Add the above created values to the chart Object using the add_data() function.
chartObj.add_data(xl_values)
# Add the above chart to the sheet using the add_chart() function which starts the chart from f2 cell
worksheet.add_chart(chartObj, 'f2')
Step5: Saving the Output Excel File with some random name
# Save the output excel file of the above workbook object with some random name
# using the save() function
workbookObj.save('OutputExcelFile.xlsx')
Complete Code
Approach:
- Import openpyxl module using the import keyword
- Import BarChart, Reference from chart of openpyxl module using the import keyword
- Pass the excel file path to the load_workbook() function of openpyxl module which is the file we want to work with and store it in a variable
- Access ‘Sheet1’ from the above workbook object and store it in another variable
- Loop till the number of rows of the worksheet using the for loop
- Get the value of the third cell of the corresponding row using the cell() function
- Compute the salary after deducting the tax(10%) using mathematic logic and store it in avariable
- Create the 4th column(Net_Salary) to the above worksheet and store the cell in a variable
- Assign the modified salary to the above cell
- Store the values of the sheet in a variable using the Reference() function
- Create a BarChart() object and store it in a variable.
- Add the above-created values to the chart Object using the add_data() function.
- Add the above chart to the sheet using the add_chart() function which starts the chart from f2 cell
- Save the output excel file of the above workbook object with some random name
using the save() function. - The Exit of the Program.
Below is the implementation:
# Import openpyxl module using the import keyword
import openpyxl
# Import BarChart, Reference from chart of openpyxl module using the import keyword
from openpyxl.chart import BarChart, Reference

# Pass the excel file path to the load_workbook() function of openpyxl module
# which is the file we want to work with and store it in a variable
workbookObj  = openpyxl.load_workbook('SampleExcelFile.xlsx')
# Access 'Sheet1' from the above workbook object and store it in another variable
worksheet = workbookObj['Sheet1']
# Loop till the number of rows of the worksheet using the for loop
for row in range(2, worksheet.max_row + 1):
  # Get the value of the third cell of the corresponding row using the cell() function
    cell = worksheet.cell(row, 3)
  # Compute the salary after deducting the tax(10%) using mathematic logic and store it in avariable
    salary_after_tax_deduction = float(cell.value) * 0.9

  # Create the 4th column(Net_Salary) to the above worksheet and
  # Store the cell in a variable
    Net_Salary = worksheet.cell(row, 4)
  #  Assigned the modified salary to the above cell
    Net_Salary.value = salary_after_tax_deduction

# Store the values of the sheet in a variable using the Reference() function
xl_values = Reference(worksheet, min_row=2, max_row=worksheet.max_row, min_col=4, max_col=4)
# Create a BarChart() object and store it in a variable.
chartObj = BarChart()
# Add the above created values to the chart Object using the add_data() function.
chartObj.add_data(xl_values)
# Add the above chart to the sheet using the add_chart() function which starts the chart from f2 cell
worksheet.add_chart(chartObj, 'f2')

# Save the output excel file of the above workbook object with some random name
# using the save() function
workbookObj.save('OutputExcelFile.xlsx')
Output:
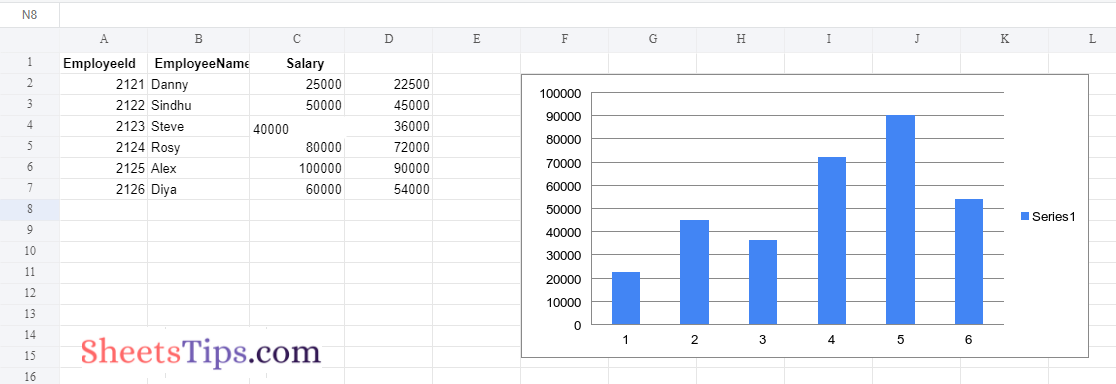
Now you know exactly how to automate the Excel data using Python. This is just an example. With the help of Python, we can automate various kinds of data and stop doing repetitive tasks.