

Plotting a graph in R with an excel file requires an excel file with two columns, with the values in the first column representing the x-axis and the values in the second column representing the y-axis.
In this tutorial, we will look at how to plot a graph in R language using an excel file.
read_excel() Function:
The read_excel() method is used to import and read an Excel file and is only accessible after the readxl library has been imported into the R program.
This read_excel() will read an excel file from the current working directory.
Syntax:
read_excel(filepath)
Parameters
filepath: It is the input file to be read or imported
Installation of readxl package
Before we work with this package we must first install it. Type the below command in the R console:
install.packages("readxl")Output:
Installing package into ‘C:/Users/cirus/AppData/Local/R/win-library/4.2’
(as ‘lib’ is unspecified)
--- Please select a CRAN mirror for use in this session ---
trying URL 'https://cloud.r-project.org/bin/windows/contrib/4.2/readxl_1.4.0.zip'
Content type 'application/zip' length 1197616 bytes (1.1 MB)
downloaded 1.1 MB

package ‘readxl’ successfully unpacked and MD5 sums checked

The downloaded binary packages are in
C:\Users\cirus\AppData\Local\Temp\Rtmpo5UGo0\downloaded_packages
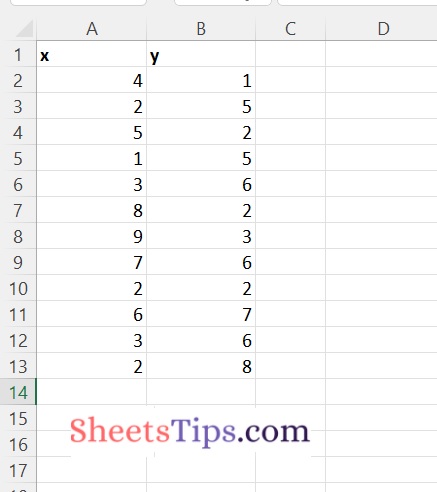
Here we now work with the plotExcelFile.xlsx
plotExcelFile.xlsx:
Plotting an Excel File Data in R
Given an excel file below is the full approach to plot the given excel file data in r
plot() function:
The plot() function is used to plot R objects. By default, this function returns a scatter plot with the parameters provided.
Syntax:
plot(x, y, main, xlab, ylab, sub, asp)
Parameters
- x: These are the x coordinates of points present in the plot
- y: These are the y coordinates of points present in the plot
- main: It is the name of the main title of the plot.
- xlab: It is a heading/title for the x-axis
- ylab: It is a heading/title for the y-axis
- sub: It is the name of the subtitle of the plot.
- asp: It is the y/x aspect ratio
Return Value:
This plot() function returns a Scatter plot of the x and y values given.
Approach:
- Import the readxl package using the library() function
- Pass the Excel file path to be read as an argument to the read_excel() function and store it in a variable.
- Here it reads/imports the given excel file.
- Pass the x and y coordinates of points present in the plot, xlabel, ylabel, main title of the plot as arguments to the plot() function to plot the graph of the given Excel file.
- The Exit of the Program.
Below is the implementation:
# Import the readxl package using the library() function
library(readxl)

# Pass the Excel file path to be read as an argument to the read_excel() function
# and store it in a variable.
# Here it reads/imports the given excel file.
excelFilePath <- read_excel("C:/Users/cirus/Downloads/plotExcelFile.xlsx")

# Pass the x and y coordinates of points present in the plot, xlabel, ylabel,
# main title of the plot as arguments to the plot() function to plot the
# graph of the given Excel file
plot(x = excelFilePath$x, y = excelFilePath$y,
    xlab = "x-axis",
    ylab = "y-axis",
    main = "Plotting an Excel File"
)
Output:
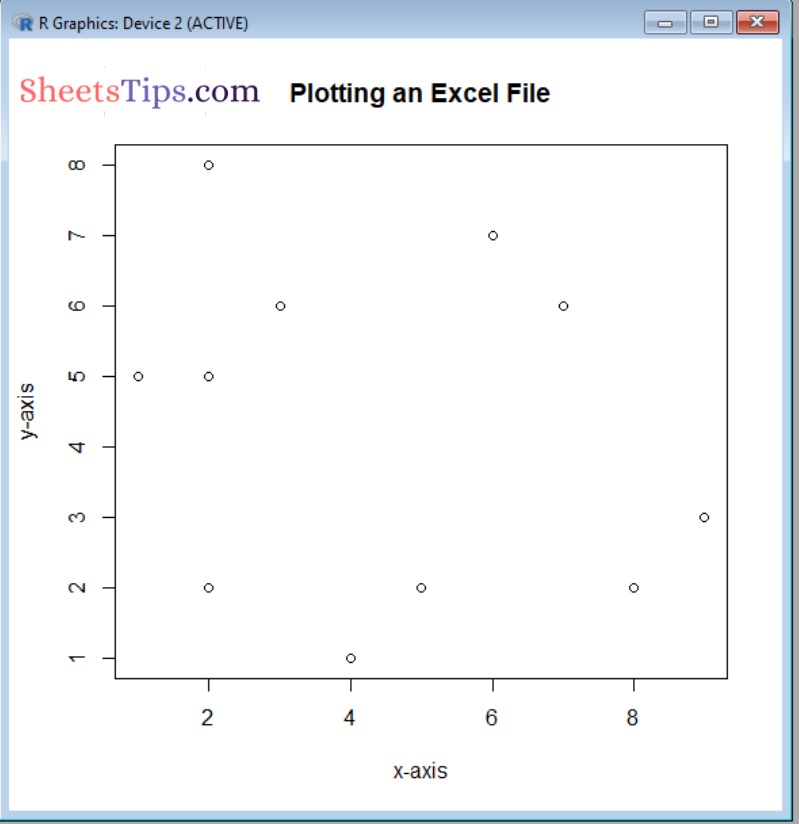
It plots the x,y columns data .