Below are the ways to plot the different types of style charts in an excel sheet using the XlsxWriter module in Python.
Charts are made up of a series of one or more data points. The series are made up of references to cell ranges. To plot the charts on an excel sheet, first create a chart object of the desired chart type ( i.e Stock chart, etc.). After generating chart objects, insert data into them before adding them to the sheet object.
Also Read: Python Interview Questions on Decision Making and Loops
Install the xlsxwriter using the below code
pip install xlsxwriter
Looking in indexes: https://pypi.org/simple, https://us-python.pkg.dev/colab-wheels/public/simple/
Collecting xlsxwriter
Downloading XlsxWriter-3.0.3-py3-none-any.whl (149 kB)
|████████████████████████████████| 149 kB 5.0 MB/s
Installing collected packages: xlsxwriter
Successfully installed xlsxwriter-3.0.3
Program to Plot Different types of Style Charts in Excel Sheet using XlsxWriter module in Python
Approach:
- Import the xlsxwriter library using the import function.
- Pass the excel file path to the Workbook() function of xlsxwriter which is the file we want to create and store in a variable.
- Give the chart types as a static list and store them in a variable.
- Iterate in the chart types list using the for loop.
- Create the new Worksheet using the add_worsheet() function and apply it to the above workbook object and store it in a variable.
- Pass the Argument chartType(Iterator) and apply title() function to it.
- Set the zoom option using the set_zoom() function and pass the zoom value to it as an argument.
- Take a variable and initialize the StyleNumber with some random value.
- Creating the 48 Built-in styles where each style is a different style.
- Here the each chart dimension is 15 X 8.
- Using the add_chart() method, create a chart object that can be added to a worksheet.
- Pass the type of chart as an argument to the add_chart() function and apply it to the above workbook object.
- Add the series of the data using the add_series() function.
- Set the title to the chartObject using the set_title() function by passing the title styleNumber as value and key as “name” (Here the arguments are object).
- Turn off the chart legend by passing the key ‘none’ as True to the set_legend() function.
- Set the style of the chart using the set_style() function.
- Add the chart Object to the worksheet by passing the row Number, Column, and chart object as argument to the insert_chart() function.
- Increment the style Number by 1.
- Create the new Worksheet using the add_worsheet() function and apply it to the above workbook object and store it in a variable.
- Here this worksheet is used to store the data.
- Create some random data list and store it in a variable.
- Write the dataValues to the A1 column of the data Worksheet using the write_column() function and apply on the data Worksheet.
- Hide the data Worksheet using the hide() function.
- Close the workbook Object using the close() function.
- The Exit of the Program.
Below is the Implementation:
# Import the xlsxwriter library using the import function
import xlsxwriter
# Pass the excel file path to the Workbook() function of xlsxwriter
# which is the file we want to create and store it in a variable
workbookObj = xlsxwriter.Workbook('chartStyles.xlsx')
# Give the chart types as static list and store it in a variable
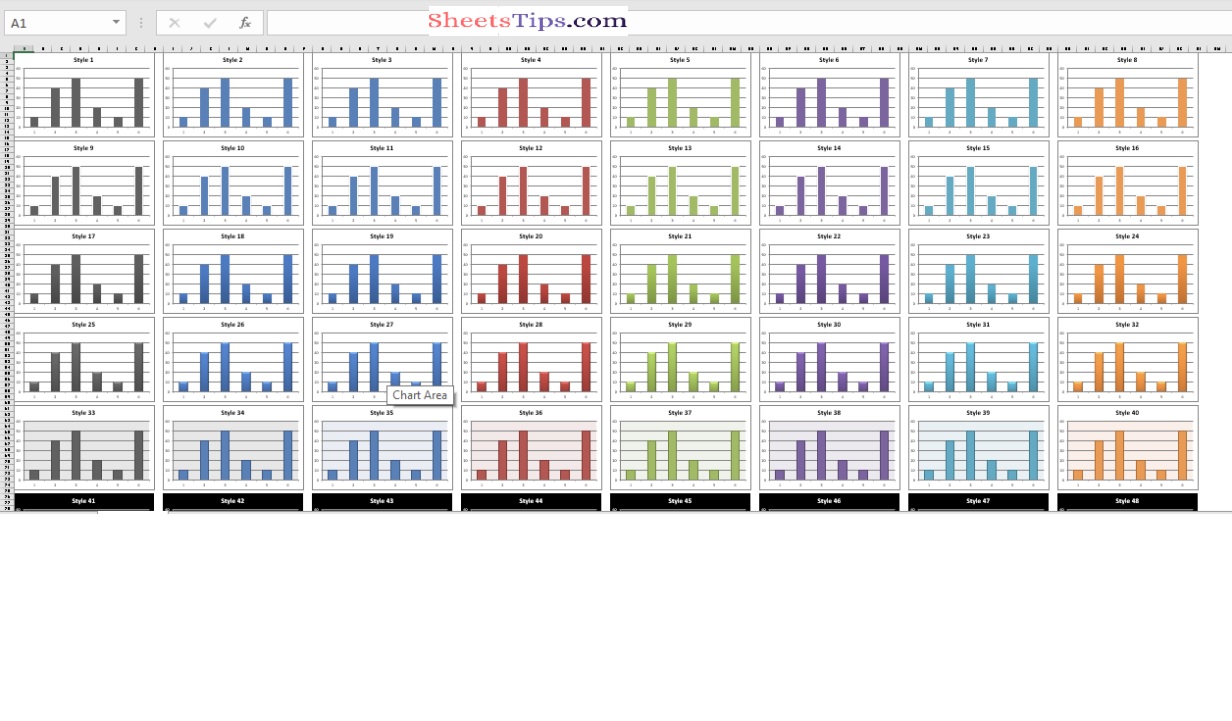
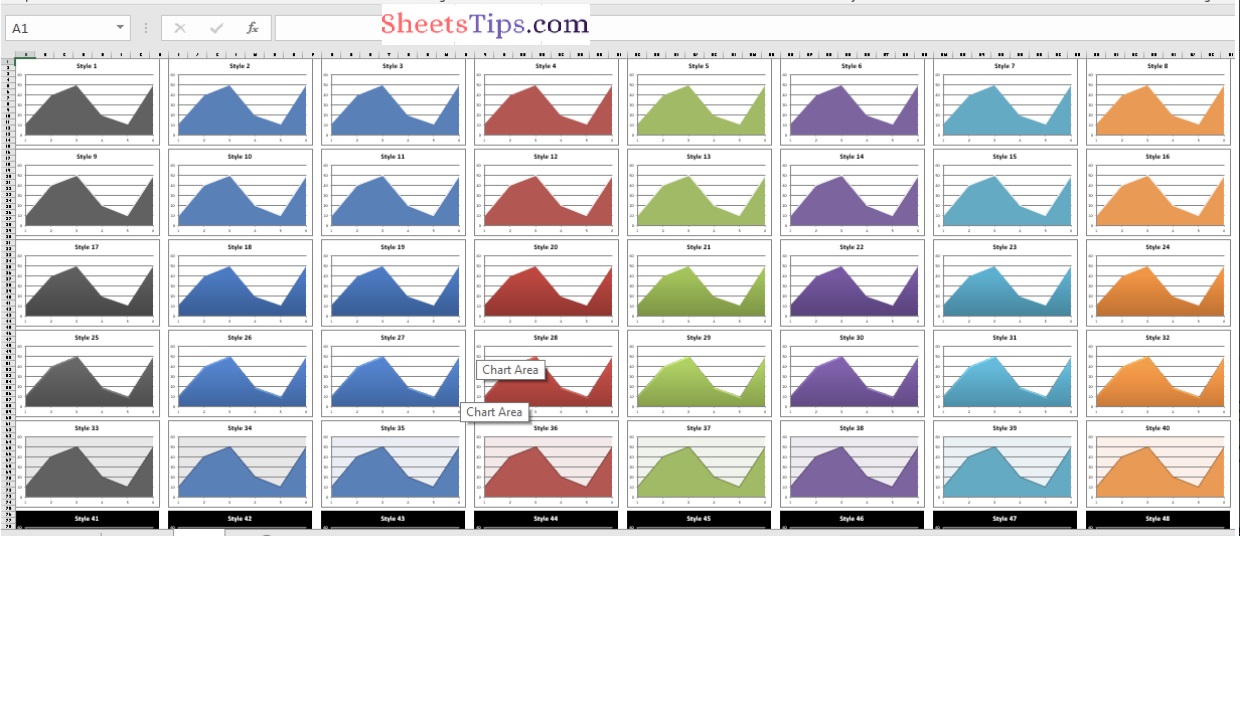
chartTypes = ['column', 'area']
# Iterate in the chart types list using the for loop
for chartType in chartTypes:
# Create the new Worksheet using the add_worsheet() function and
# apply it to the above workbook object and store it in a variable
#Pass the Argument chartType(Iterator) and apply title() function to it.
newWorksheet = workbookObj.add_worksheet(chartType.title())
# set the zoom option using the set_zoom() function and pass the zoom value to it as an argument
newWorksheet.set_zoom(20)
# Take a variable and initialize the StyleNumber with some random value
styleNumber = 1
# Creating the 48 Built in styles where each style is different style
# Here the each chart dimension is 15 X 8
for rowNum in range(0, 90, 15):
for colNum in range(0, 64, 8):
# Using the add_chart() method, create a chart object that can be added to a worksheet.
# Pass the type of chart as an argument to the add_chart() function and apply it to the above workbook object
chartObj = workbookObj.add_chart({'type': chartType})
# Add the series of the data using the add_series() function
chartObj.add_series({'values': '= Data !$A$1:$A$6'})
# Set the title to the chartObject using the set_title() function by passing the title styleNumber as value and key as "name" (Here the arguments are object)
chartObj.set_title ({'name': 'Style % d' % styleNumber})
# Turn off the chart legend by passing the key 'none' as True to the set_legend() function
chartObj.set_legend({'none': True})
# Set the style of the chart using the set_style() function
chartObj.set_style(styleNumber)
# Add the chart Object to the worksheet by passing the
# row Number,Column and chartObject as argument to the insert_chart() function
newWorksheet.insert_chart(rowNum, colNum, chartObj)
# Increment the style Number by 1
styleNumber += 1
# Create the new Worksheet using the add_worsheet() function and
# apply it to the above workbook object and store it in a variable
# Here this worksheet is used to store the data
dataWorksheet = workbookObj.add_worksheet()
# Create some random data list and store it in a variable
dataValues = [20, 30, 40, 10, 20, 60]
# Write the dataValues to the A1 column of the data Worksheet using the write_column() function and apply on the data Worksheet
dataWorksheet.write_column('A1', dataValues)
# Hide the data Worksheet using the hide() function
dataWorksheet.hide()
# Close the workbook Object using the close() function.
workbookObj.close()
Output: