Google Finance is one of the most useful functions that was recently introduced. With the Google Sheets Finance function, we can easily track stock prices are earnings per share. Using this function in Spreadsheet will help us to retrieve current or historical stock market data from Google Finance. However, to track the stocks in Google Sheets, we will have to use the GOOGLE FINANCE Syntax. On this page, let us understand everything about Google Sheets Stock Analysis using the Sheets Tips provided on this page. Read further to find more.
| Table of Contents |

Google Finance Function Syntax
The syntax to use the Google Sheets finance function is as follows:
GOOGLEFINANCE(ticker, [attribute], [start_date], [end_date|num_days], [interval])
- Ticker: The ticker symbol for the security to be considered. For accurate results and to eliminate discrepancies, both the exchange symbol and the ticker symbol must be used. For example, instead of “GOOG,” use “NASDAQ:GOOG.”
- If you don’t choose an exchange symbol, GOOGLEFINANCE will choose one for you based on its best judgement.
- Attribute: The attribute you want to display is the second argument. If you leave it blank, it defaults to “price.” Using the function, you can extract the following attributes:
- price: The current price of a given stock.
- volume: The current trade volume is referred to as volume.
- high: Today’s or a certain day’s high price.
- low: Today’s or a certain day’s lowest price.
- volumeavg: The average daily trading volume.
- pe: pe stands for price-to-earnings ratio.
- eps: eps stands for “earnings per share.
How To Track Stocks in Google Sheets with Example?
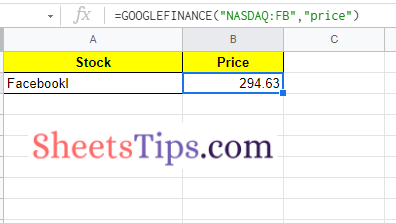
Now let us understand how to track stocks in Google Spreadsheet using an example. Let us assume that we want to track the stock prices of Facebook. Facebook is listed in NASDAQ with the ticker code FB. So here our ticker code will be NASDAQ:FB and our attribute will be price. So our formula here is =GOOGLEFINANCE(“NASDAQ:FB”,”price”).
- How to Convert Currency in Google Sheets? – Google Finance Currency Conversion
- Pi Function in Google Sheets: Discover & Generate π Function in Google Sheets
- REPT Function In Google Sheets – How To Repeat Rows in Google Sheets?
Follow the steps as listed below to track stocks of FB in Google Sheets:
- 1st Step: Open the Google Spreadsheet.
- 2nd Step: Now in column 1, enter the stock name for which you would like to track as shown in the image below.
- 3rd Step: Here in column 2, against the stock name, enter the formula =GOOGLEFINANCE(“NASDAQ:FB”,”price”).
- 4th Step: Press the “Return” key and you will see the results as shown below.
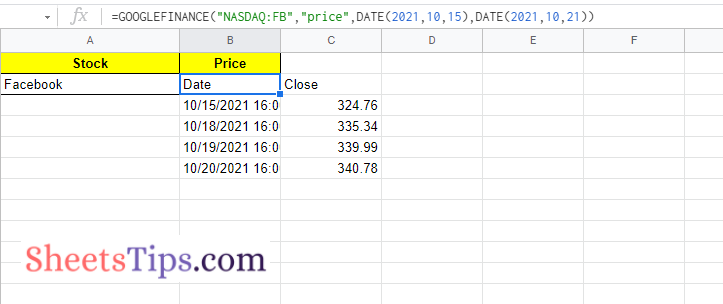
If you wish to see the daily closing prices for a specific week, such as the week of October 15, 2021, use the third and fourth options to set the date range.
=GOOGLEFINANCE(“NASDAQ:FB”,”price”,DATE(2021,10,15),DATE(2021,10,21)) is the code for this. It’s important to note that viewing previous data extends the generated data into array data, which fills surrounding cells.
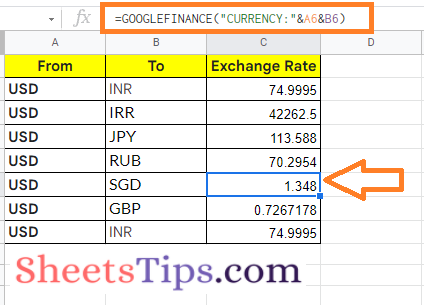
How To Convert Currency in Google Sheets?
Follow the steps as listed below to convert currency in Google Spreadsheet:
- Step 1: Select the cell where you want the currency conversion results to be shown.
- Step 2: Now type =GOOGLEFINANCE(“CURRENCY:”&A2&B2) into the calculator.
- Step 3: After pressing the “Enter” key, the results will appear as shown below.