
Anyone knows how to create line charts in Google Sheets. But do you know how to create Multi Colored Line Charts in Google Sheets? If not, then you don’t have to worry. In this tutorial, we will learn everything about how to create a multi colored Line Charts with the help of Google Sheets Tips and Tricks. Read further to find more.
Table of Contents |
Prerequisites to Create Multi Color Chart in Google Sheets
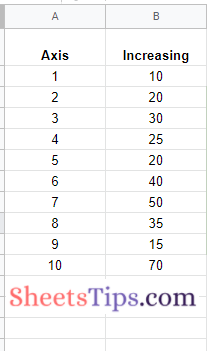
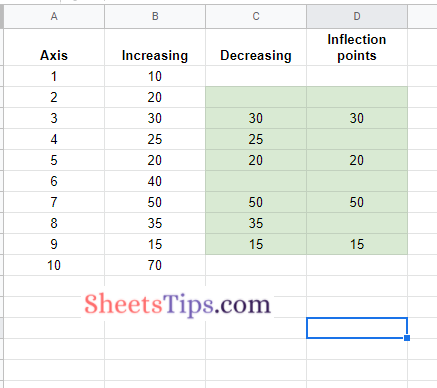
To create a multi color line graph in Google Spreadsheet, we must first devise the dataset for which the line chart needs to be created. In this article, we are creating a dataset as shown in the image given below:
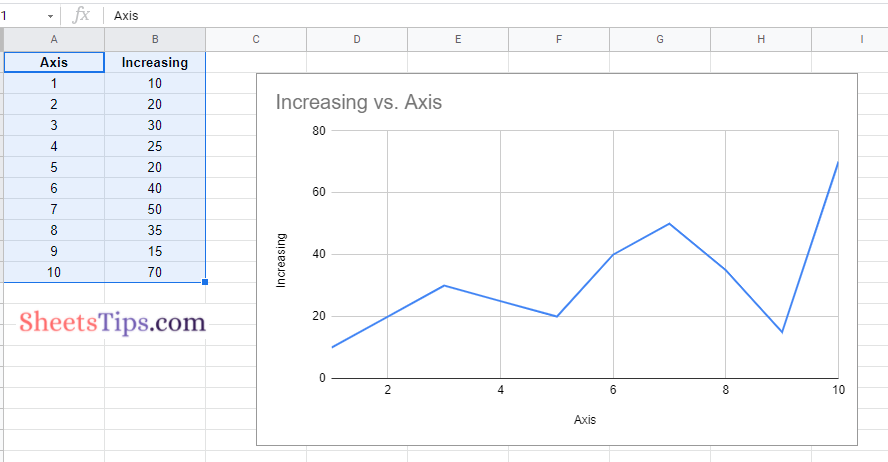
So when you try to create a Line chart using the above dataset, we will simply get a Line Chart as shown below.
- How to Add Labels to Legend in Google Sheets (Step by Step Procedure)
- How to Make a Line Chart in Google Sheets: Setup/Edit/Customize Line Graph
- How To Switch Chart Axes in Google Sheets? Change or Edit Axis Scale in G-Sheets
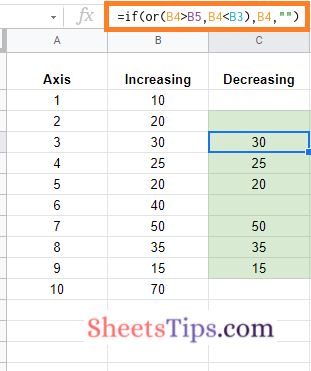
Now to create a Multiple Color Line Chart, we will need helper columns. The steps to create helper columns to generate the Multi Color Line Chart are as follows:
- 1st Step: Move to the third column which are next to the first 2 columns/
- 2nd Step: Here apply the formula “=if(or(B3>B4,B3<B2),B3,“”)“.
- 3rd Step: Now drag the formula applied cell to other cells to apply the same formula.
- 4th Step: In the fourth column, enter the formula “=if(or(B3=max(B2:B4),B3=min(B2:B4)),B3,“”)” and press the “Enter” button.
- 5th Step: Now drag the formula applied cell to other cells to apply the same formula.
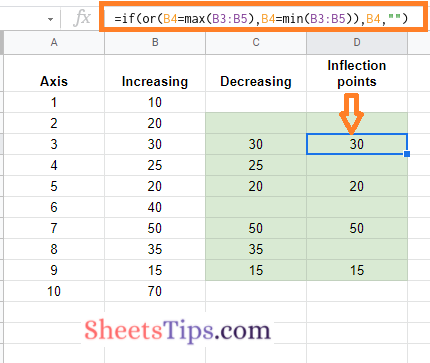
That’s it, the helper columns have been attached. Now the dataset should like the following image.
Steps To Create Multi Colored Line Chart
Now the dataset is ready. Let us start creating a Multi Colored Line graph. The steps to create a multi colored line graph are as follows:
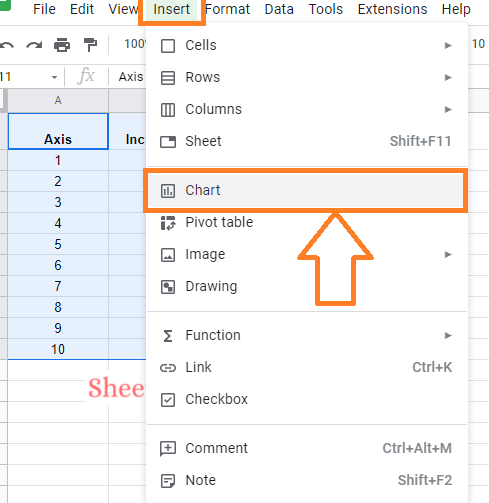
- 1st Step: Select the dataset for which you want to create a Multi Colored Line Chart.
- 2nd Step: Now on the homepage, click on the “Insert” tab from the menubar.
- 3rd Step: Choose “Charts” from the drop down menu.
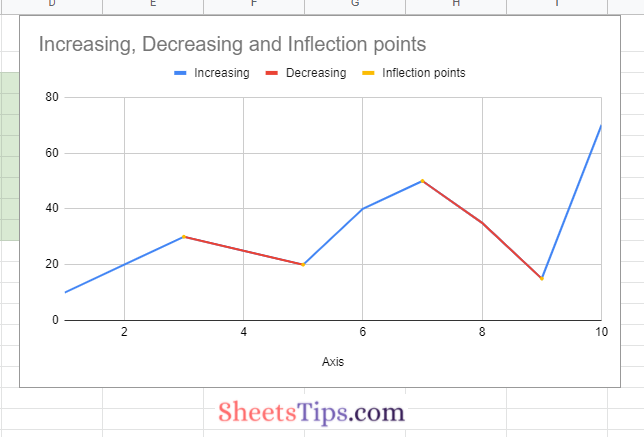
- 4th Step: Based on the dataset, Google Sheets will automatically insert a chart or graph. Luckily, in this example, the Google Sheets have inserted the Multi Color Line Chart.
- 5th Step: However, if the multi color line chart has not been inserted by default, then we will change the chart style by moving to the Chart Editor section.
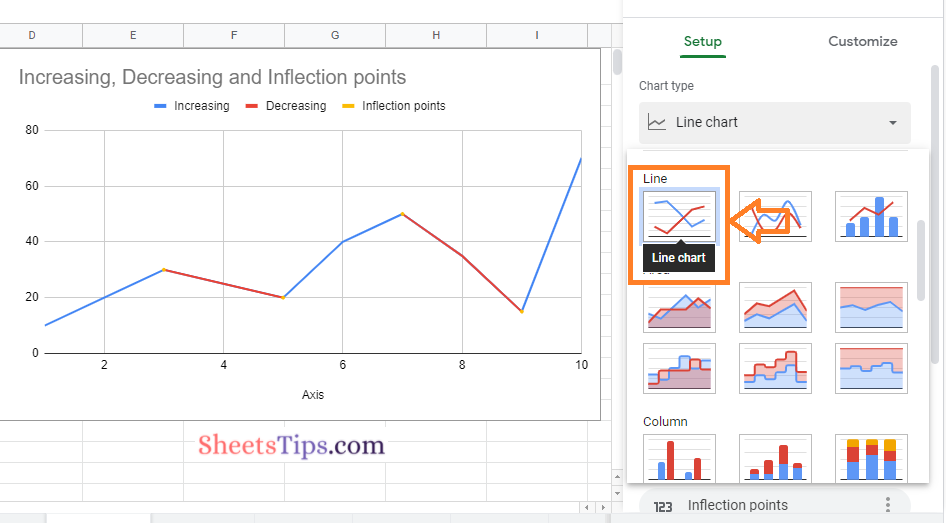
- 6th Step: Under the Chart Editor pane, click on the “Setup” section.
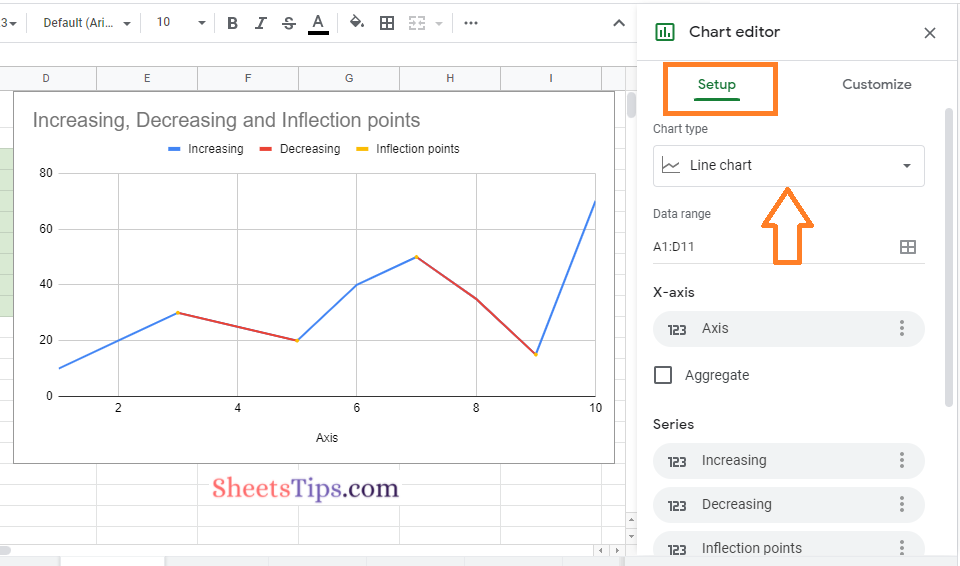
- 7th Step: From the Chart Style drop down menu, choose “Line Chart” as shown in the image below.
That’s it. The line chart has been inserted in the Google Sheets.
Customizing Multi Color Line Chart in Google Sheets
We can simply customize our Multi Color Line Chart by following the steps as outlined below:
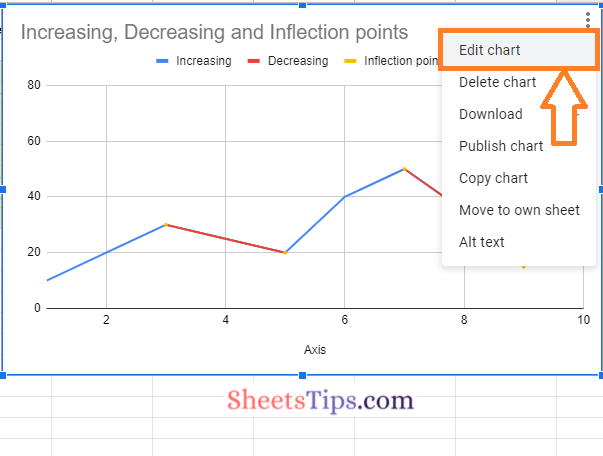
- 1st Step: Double click the chart or click on the chart and click on the 3 dots icon.
- 2nd Step: Now choose “Edit Chart” from the drop down menu.
- 3rd Step: In the Chart Editor window, move to the Customize tab.
Based on the options available, customize your Multi Color Line Chart in Google Spreadsheet.