A Google Spreadsheet with a lot of data might be intimidating. Thanks to Google Sheets Explore. With a single click in Google Sheets, we can generate summaries and visualizations of the data. Google Sheets Explore is almost as if you had a data analyst sitting next to you. However, if you don’t know how to use Explore to gain insights into your data, then this page’s Sheet Tips will help you every step of the way about Google Sheets Explore. Read further to find more.

What Insights We Can Gain Using Google Sheets Explore Feature?
The uses of the Google Spreadsheets Explore feature are given below:
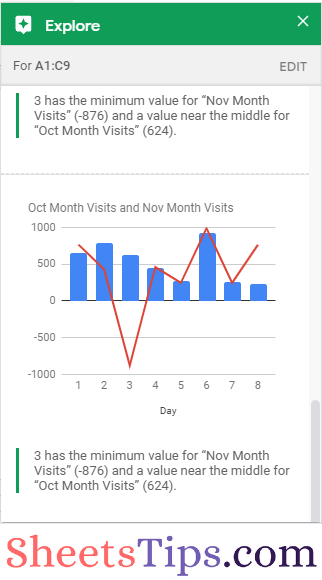
- The instant charts will help you to view the trends in your data.
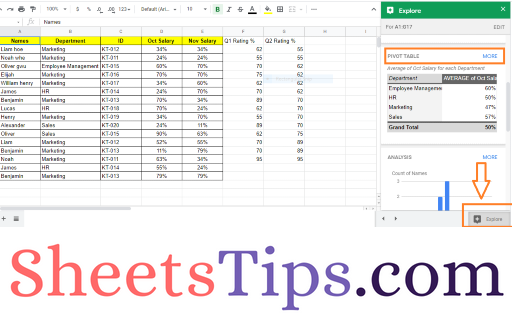
- It will automatically generate a pivot table based on the dataset.
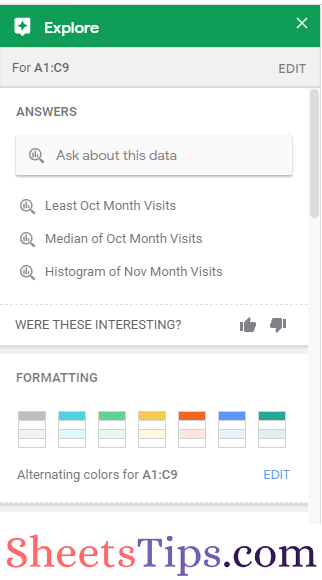
- One can also ask questions about the data and receive prompt responses from Google Sheets explore. Suggestions for answers include infographics, pivot tables, and formulas. (Only in English)
- We can select only the cells or columns we want to graph to graph a portion of your data quickly in worksheets.
- How to Insert a Pivot Table in Google Sheets? (Create/Edit/Customize Pivot Tables)
- Auto Suggested Pivot Chart in Google Sheets: Parameters for Creating Pivot Table Using Explore
- How to Refresh Pivot Table in Google Sheets: 3 Ways to Refresh Pivot Tables
How to Start Exploring Data using Google Sheets Explore?
The steps to explore data using Google Sheets Explore are given below:
- Step 1: In Google Sheets, open a spreadsheet where you want to analyze the data.
- Step 2: Select the range of rows, columns, and cells for which you want to get insights into the data.
- Step 3: Now click on the “Explore” button which is towards the bottom of the sheets.
- Step 4: Depending on the data in the sheet, you will be provided with options with the help of which you can get the insights for your data.
For example, you will be able to perform the following operations.
- Hover your mouse over a graphic to see the data it is based on in the spreadsheet.
- Enter a search term or select a recommended topic to ask about your data. You may add a formula to your answer by dragging it into a cell.
- Add a chart by hovering over it and clicking Insert chart.
- Insert a pivot table by hovering over it and clicking Insert pivot table.
Highlights of Google Sheets Explore Option
The highlights of Explore option are given below:
- You may see recommendations and suggestions by clicking the green symbol.
- There is no analysis to view while the icon is grey.
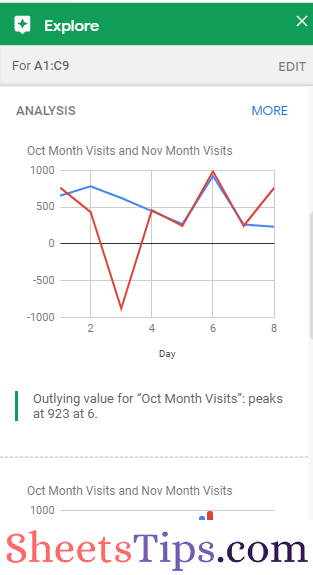
- Charts and analyses will appear, displaying trends and patterns in your worksheet’s data.
- Hover your mouse over a graphic to discover which data from the spreadsheet is being used.
- By choosing various regions of data in your spreadsheet, you may modify the suggestions.
How to Close Explore Option?
It is no rocket science to close the explore feature in Google Sheets. You will have to simply click on the X (Cross icon) in the Explore panel to close the Explore window.