Google Sheets Heatmaps are a quick and easy way to display and discover anomalies in data, and Google Sheets makes it simple to do so. We can change the color of a cell based on its value using the Google Sheets Conditional Formatting function. In this article, let’s understand everything about Heatmap functions with the help of Google Sheet tips provided on this page. Read on to find out more.
Table of Contents |
How to Create Heatmap Using Google Sheets?
Follow the steps as listed below to create a gradient heatmap in Google Sheets:
- Step 1: Select the cell range where you would like to make a heatmap.
- Step 2: Move to the menubar and hit on the “Format” tab.
- Step 3: Now select the “Conditional Formatting” from the drop-down menu.
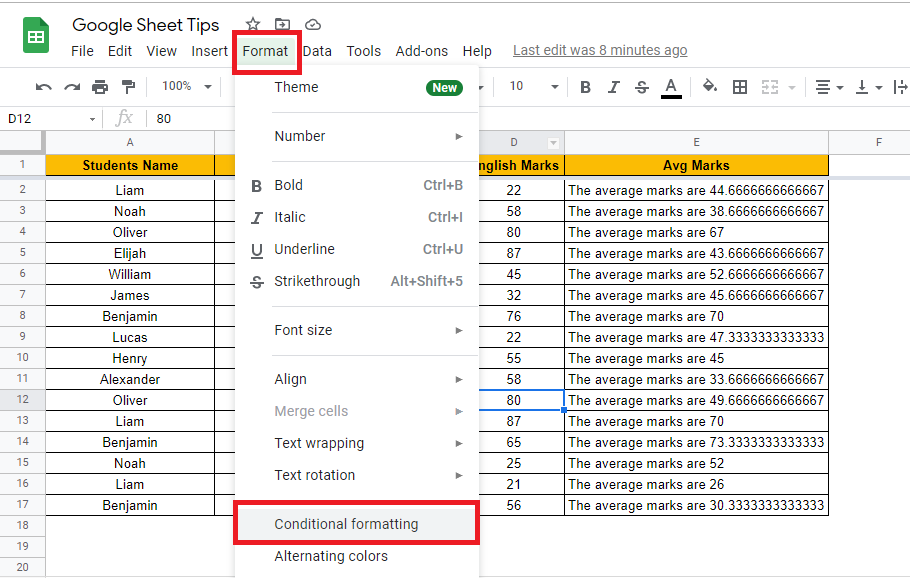
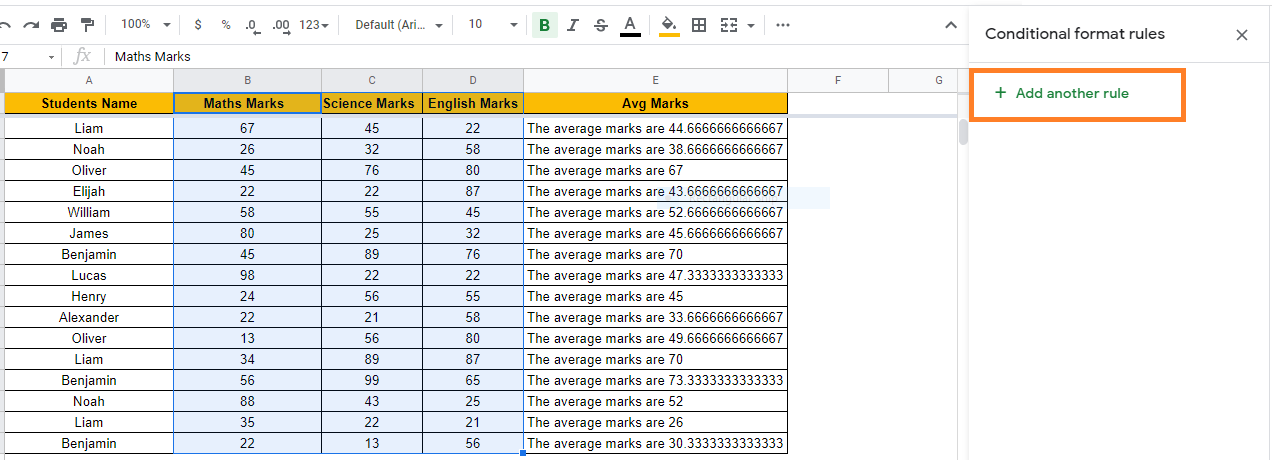
- Step 4: The Conditional Formatting window will open on the screen. Here click on “Add New Rule.”
- Step 5: Now, choose “Color Scale” from the conditional formatting pane.
- Step 6: Click Preview in the Color Scale settings to see a list of pre-defined options. It’s important to note that the color on the left corresponds to a low value, while the color on the right corresponds to a high value. You can also change the color scheme.
- Step 7: Choose the Gradient Color which you would like to apply.
- Step 8: Now press the “Done” button.
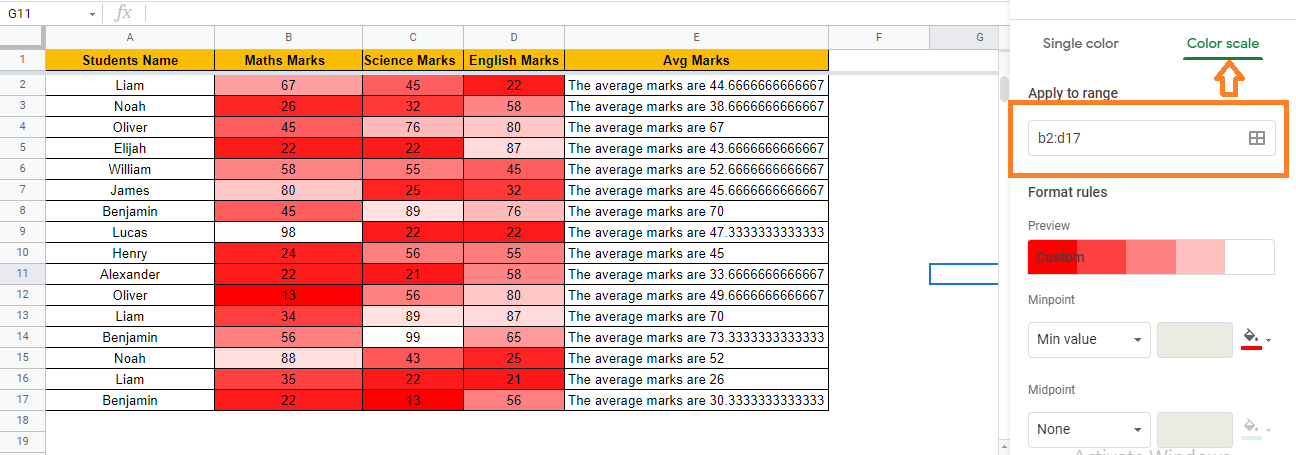
The heatmap would be created by coloring the cells based on the values.
- The Ultimate Guide to Using Conditional Formatting in Google Sheets
- How to Color Alternate Rows in Google Sheets: Alternating Colors Every 2 Rows, 3 Rows
- How to Search in Google Sheets and Highlight Matching Data? (4 Easy Methods)
How to Create Heatmap in Google Sheets using Single Color?
The gradient is applied based on the value in the cell when you use Color Scale. For example, consider the following dataset.
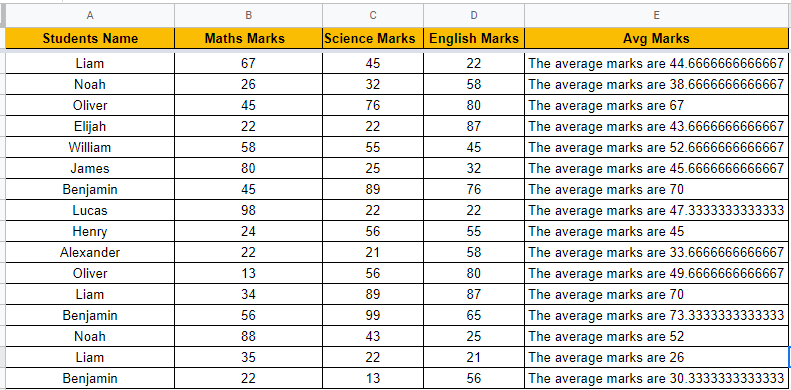
Here we have students marks. Here we must highlight the values between 35 to 90 and both the values, that is values from 35 to 90 are highlighted in red. However, because 35 is less than 90, it takes on a darker hue of red.
Let’s understand this concept that is creating the heatmap in Google Sheets using Single Color with the help of the steps given below:
- Step 1: Select the cells where you would like to create a single color heatmap.
- Step 2: Hit on the “Format” tab from the toolbar and select “Conditional Formatting” from the drop-down menu.
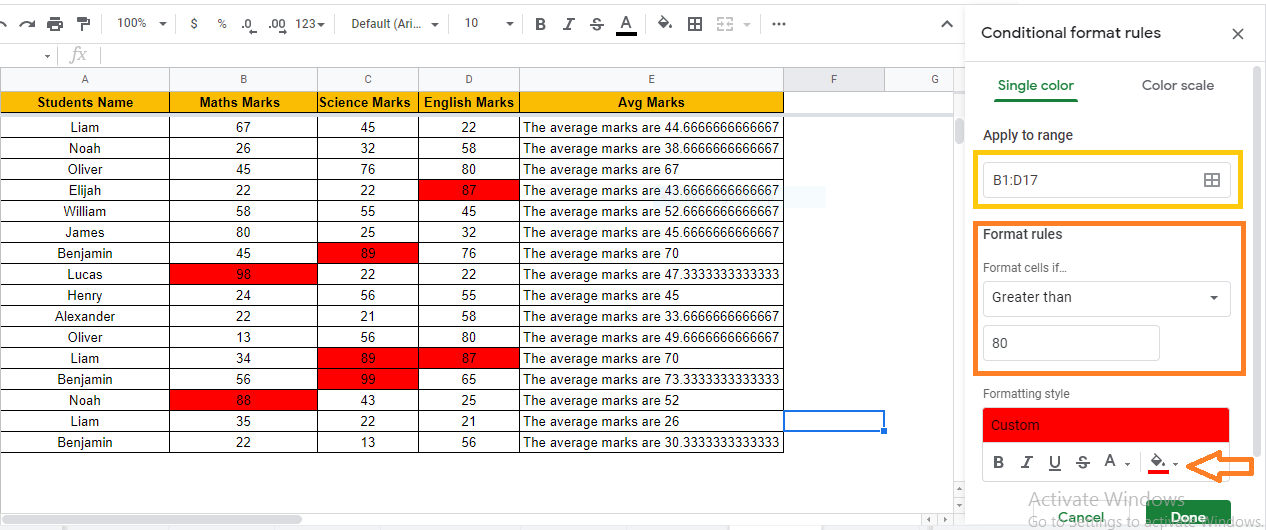
- Step 3: Now, in the “Conditional Formatting Rules” pane, click on a “Single Color.“
- Step 4: Then select the “Format cells if” and select “Greater than.”
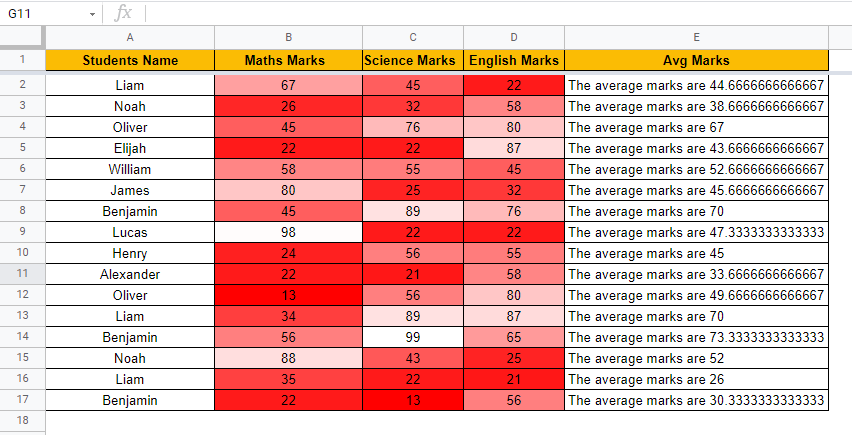
- Step 5: Now, in the field, enter the number. In our case, the number is 80.
- Step 6: Under “Formatting Style,” choose the color you want to highlight the cells.
- Step 7: Press the “Done” button, and you will be able to see the results as shown below.