Google Sheets Pie Chart: A pie chart is otherwise known as Circle Chart which is a circular graph showing proportional or relative data in a single Chart. Pie Chart is one of the most important types of charts that are used in Statistics and Data Visualisation. Also, Pie Chart is very helpful when we want to compare the data within some larger category.
In this article, we have provided all the necessary information about how to create a Pie Chart in Google sheets, customization of Pie Chart with important Google Sheet Tips. Read on to find out more.
Also Read: Probability and Statistics Notes
How to Make a Pie Chart on Google Sheets?
First, let’s understand how to create a Pie Chart with the help of an example. In the next section let’s learn how to customize the Pie Chart.
Consider the following data set.

Now let’s create a Pie Chart in Google Sheets by following the steps listed below:
- Step 1: Open the Google Spreadsheet where you want to create a Pie Chart.
- Step 2: Move to the menubar and click on the “Insert” tab.
- Step 3: Now select “Chart” from the drop-down menu.
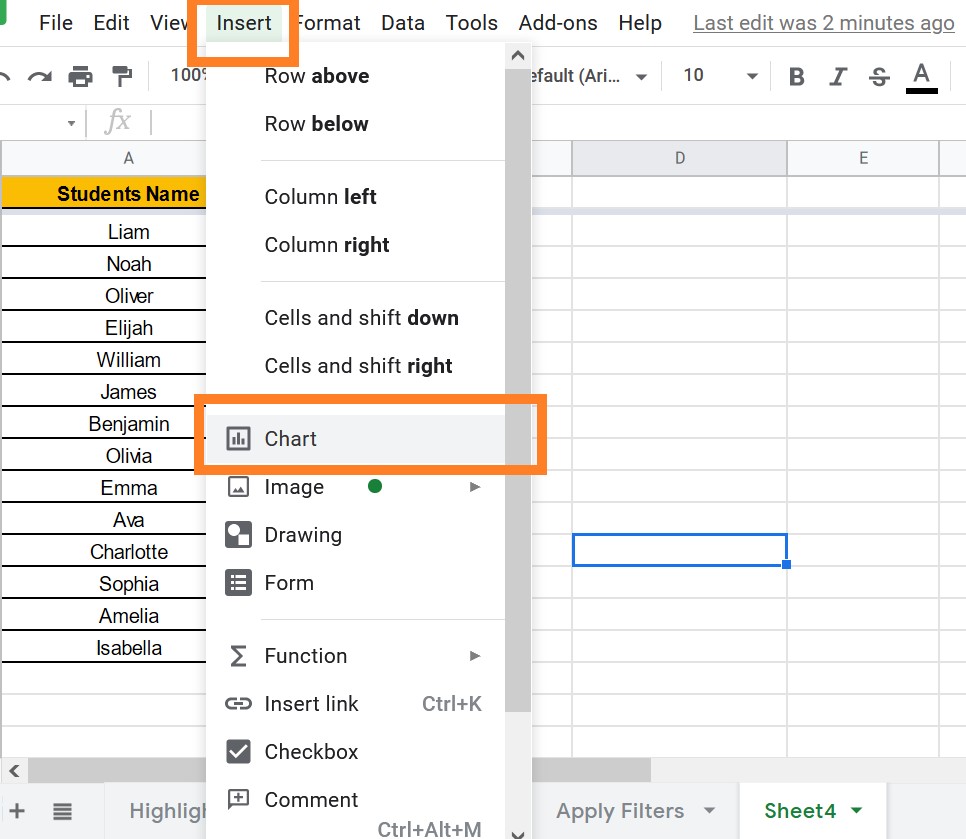
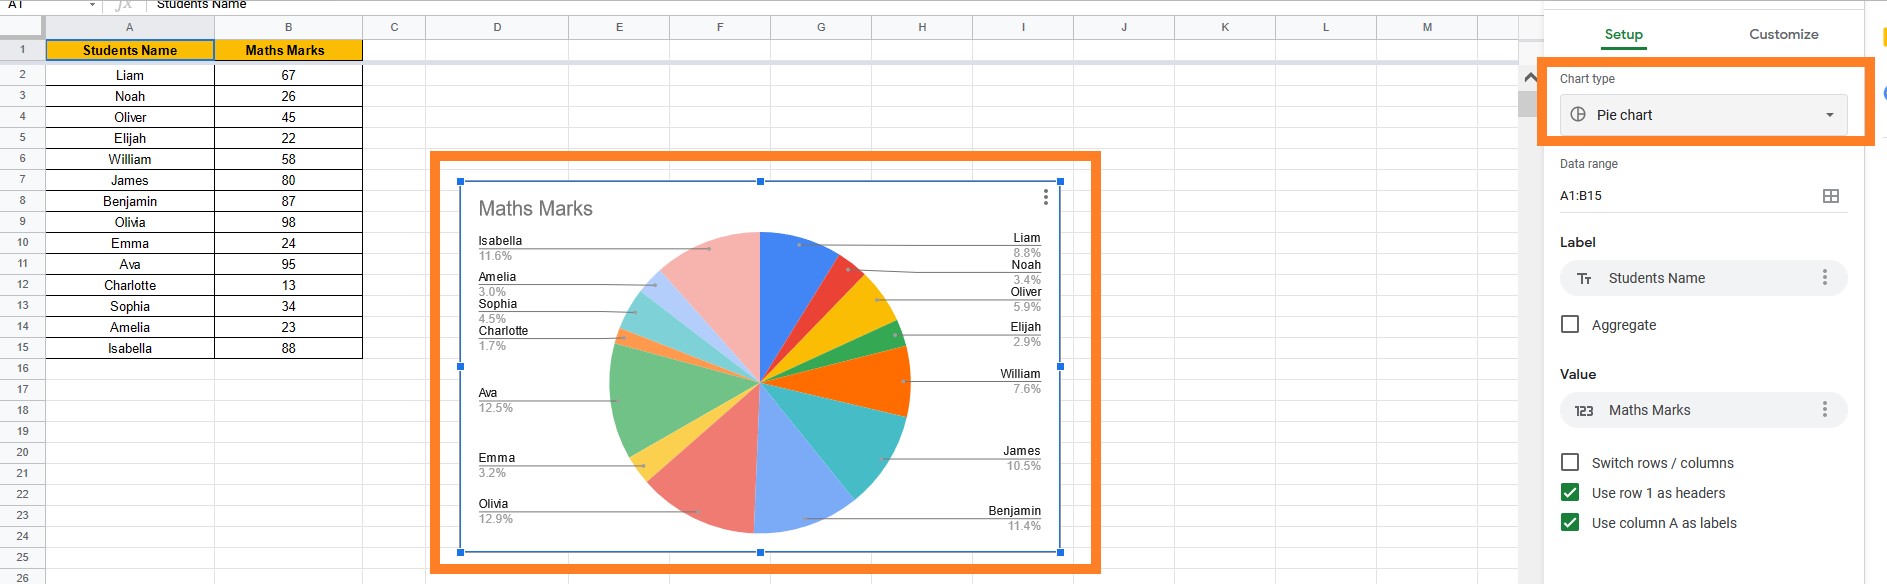
- Step 4: Now Google will try to make some assumptions based on our data and by default gives the chart.
- Step 5: If the Google Sheet showed up Pie Chart then you can start customising. Else move to the Chart editor Pane.
- Step 6: Here under the Chart Type, move to the “Pie” area.
- Step 7: You are provided with 3 Options – “Pie Chart, Doughnut Chart, 3D Chart“.
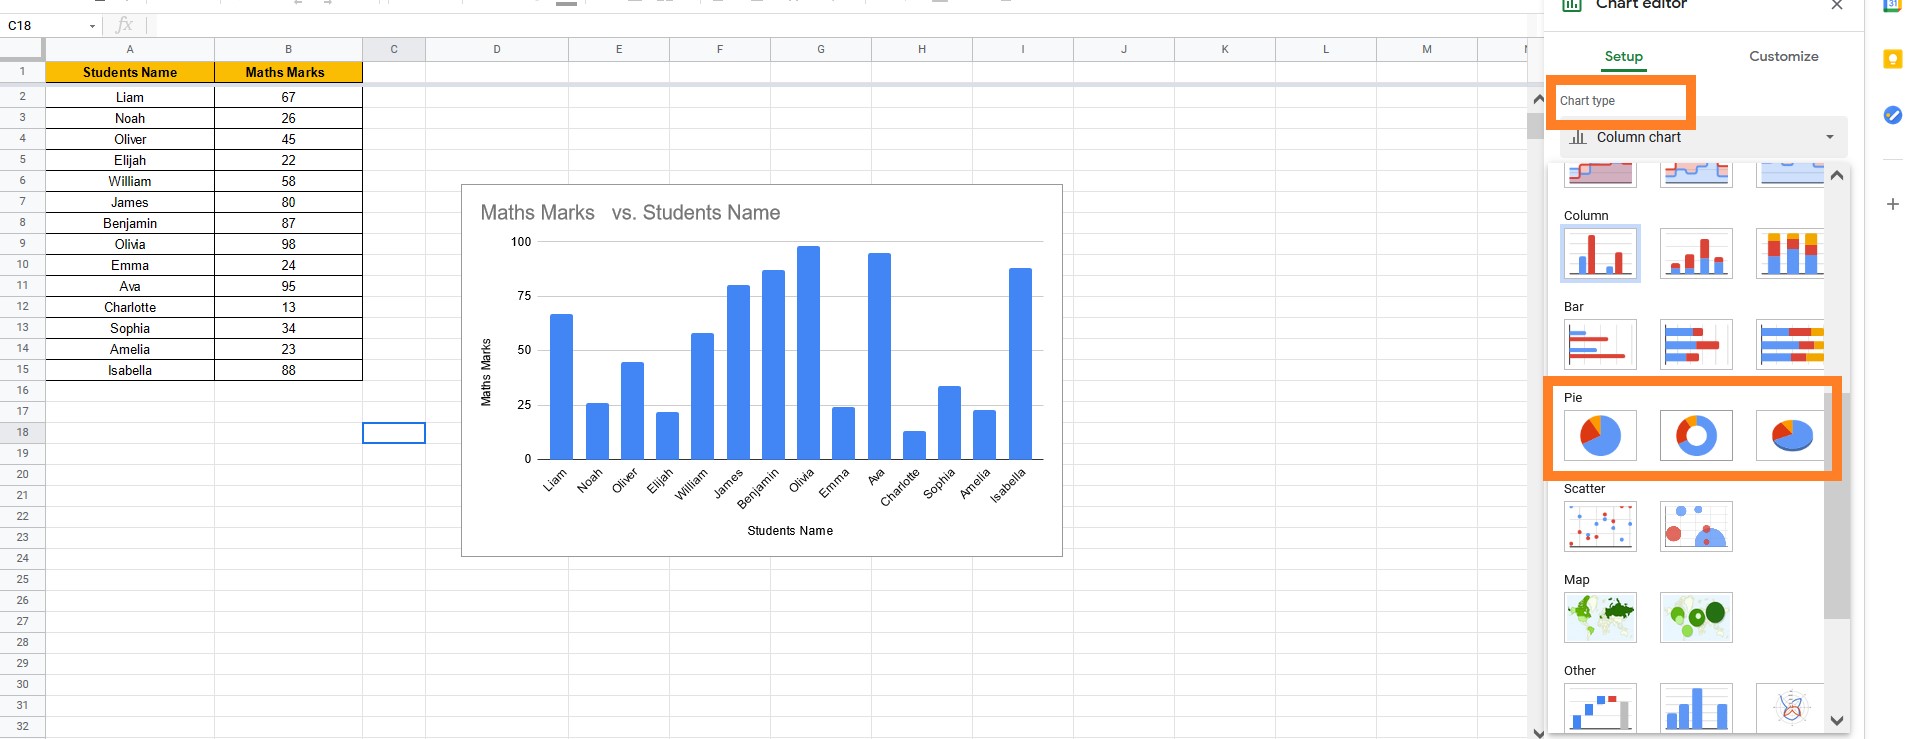
- Step 8: Click on the option and the Pie Chart will be created.
Customizing the Pie Chart on Google Sheets
By default, Google Sheets creates a Pie Chart. In order to Customize the Pie Chart, we will have to move to the Chat Editor Pane as shown below.
- How to Make an Organization Chart in Google Sheets? – Create an Org Chart in Google Sheets
- How to Make a Scatter Plot in Google Sheets (Step-by-Step)
- How to Quickly Transpose Data in Google Sheets: TRANSPOSE, Paste Special Method
How to Change Title of Pie Chart on Google Sheets?
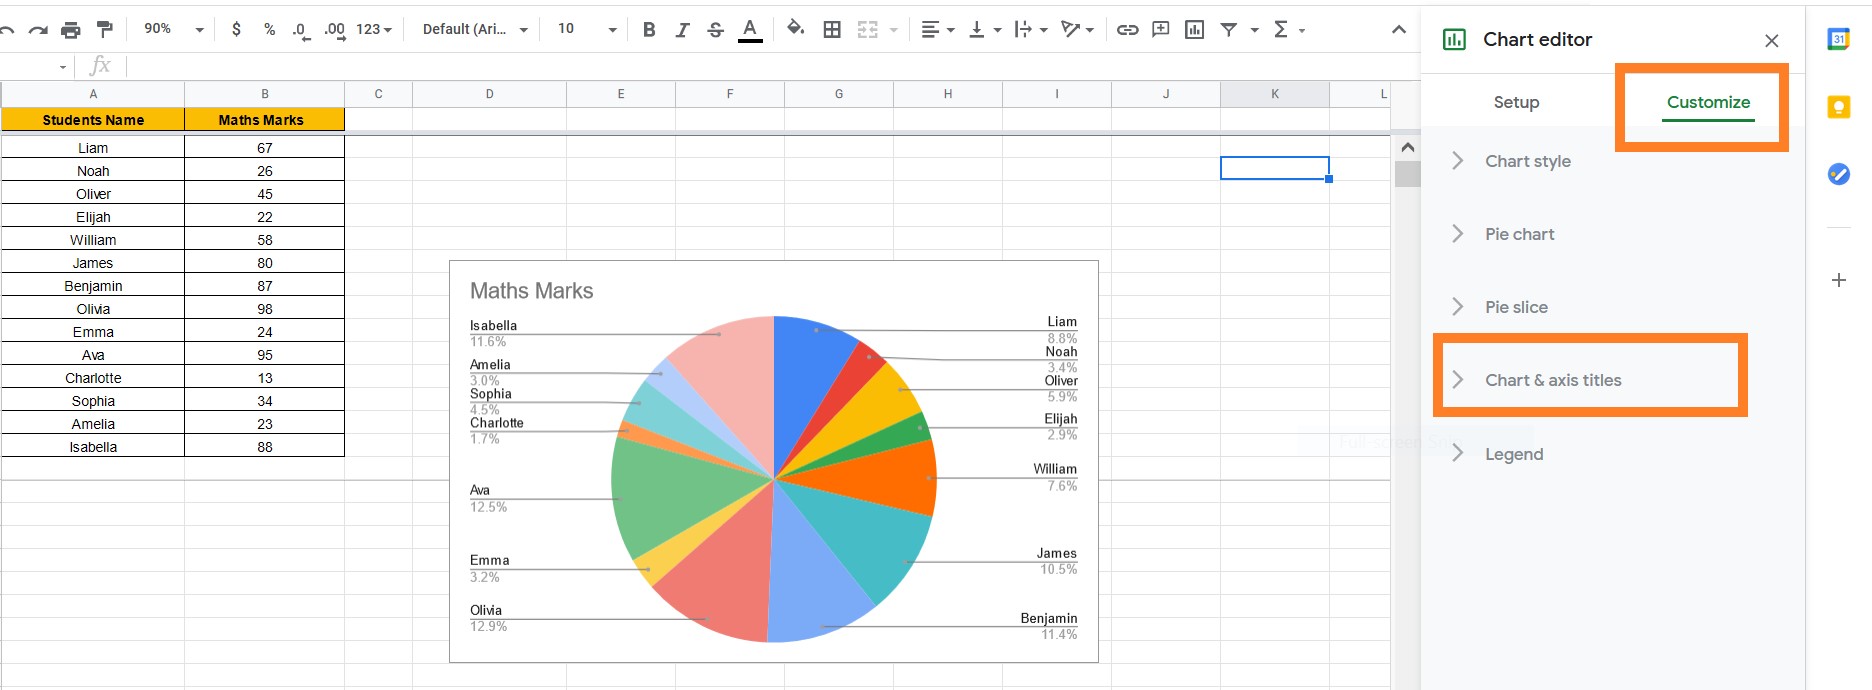
- Step 1: Click on the Pie Chart.
- Step 2: Chart Editor Pane opens up towards the right side of the screen.
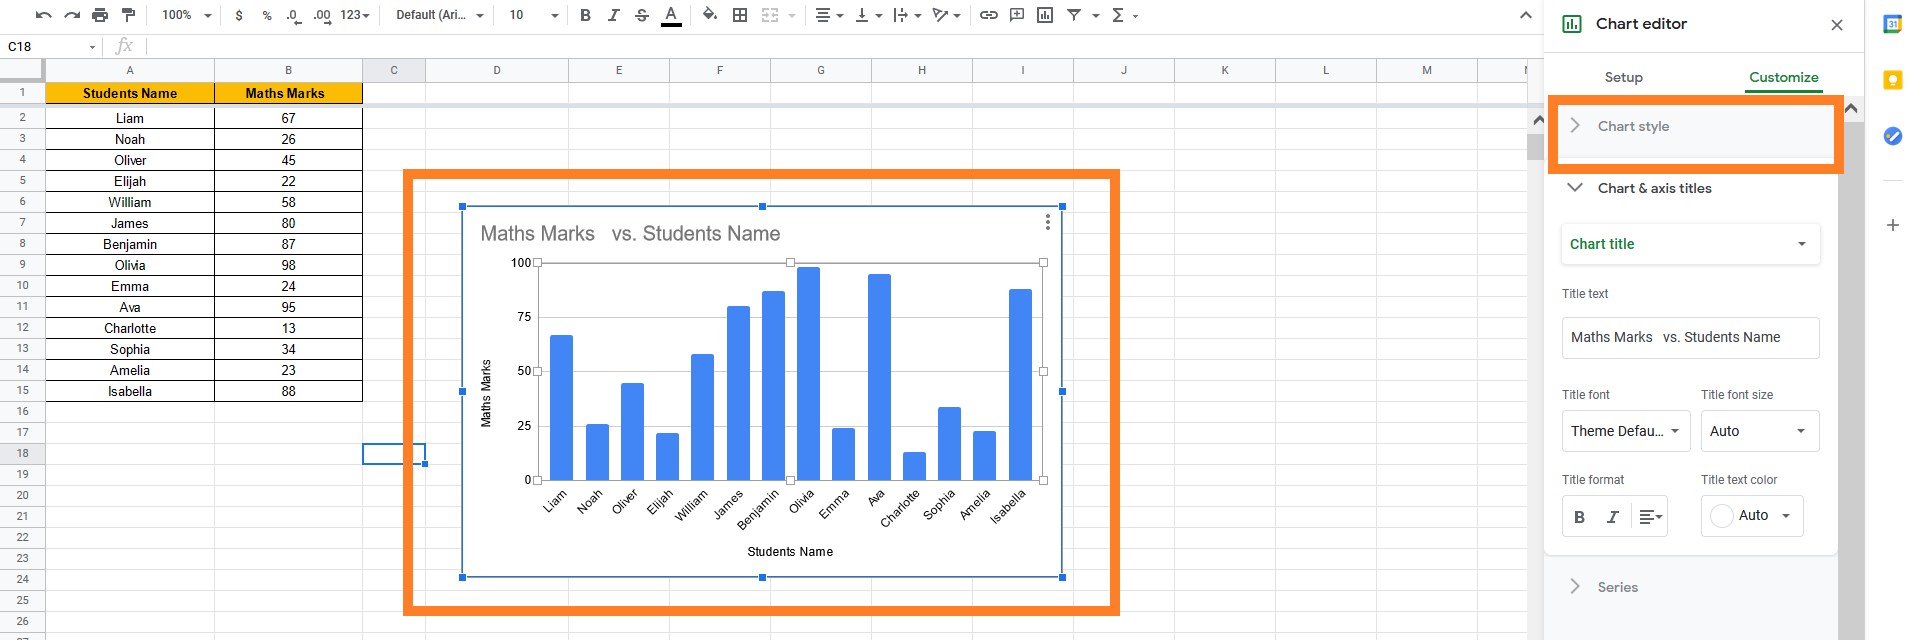
- Step 3: Now move to the “Customize” window and select “Chart & Axis titles” as shown below.
Step 4: Now you have two options – Chart Title & Subtitle. Click on the “Chart Title” to edit the chart title as shown below.
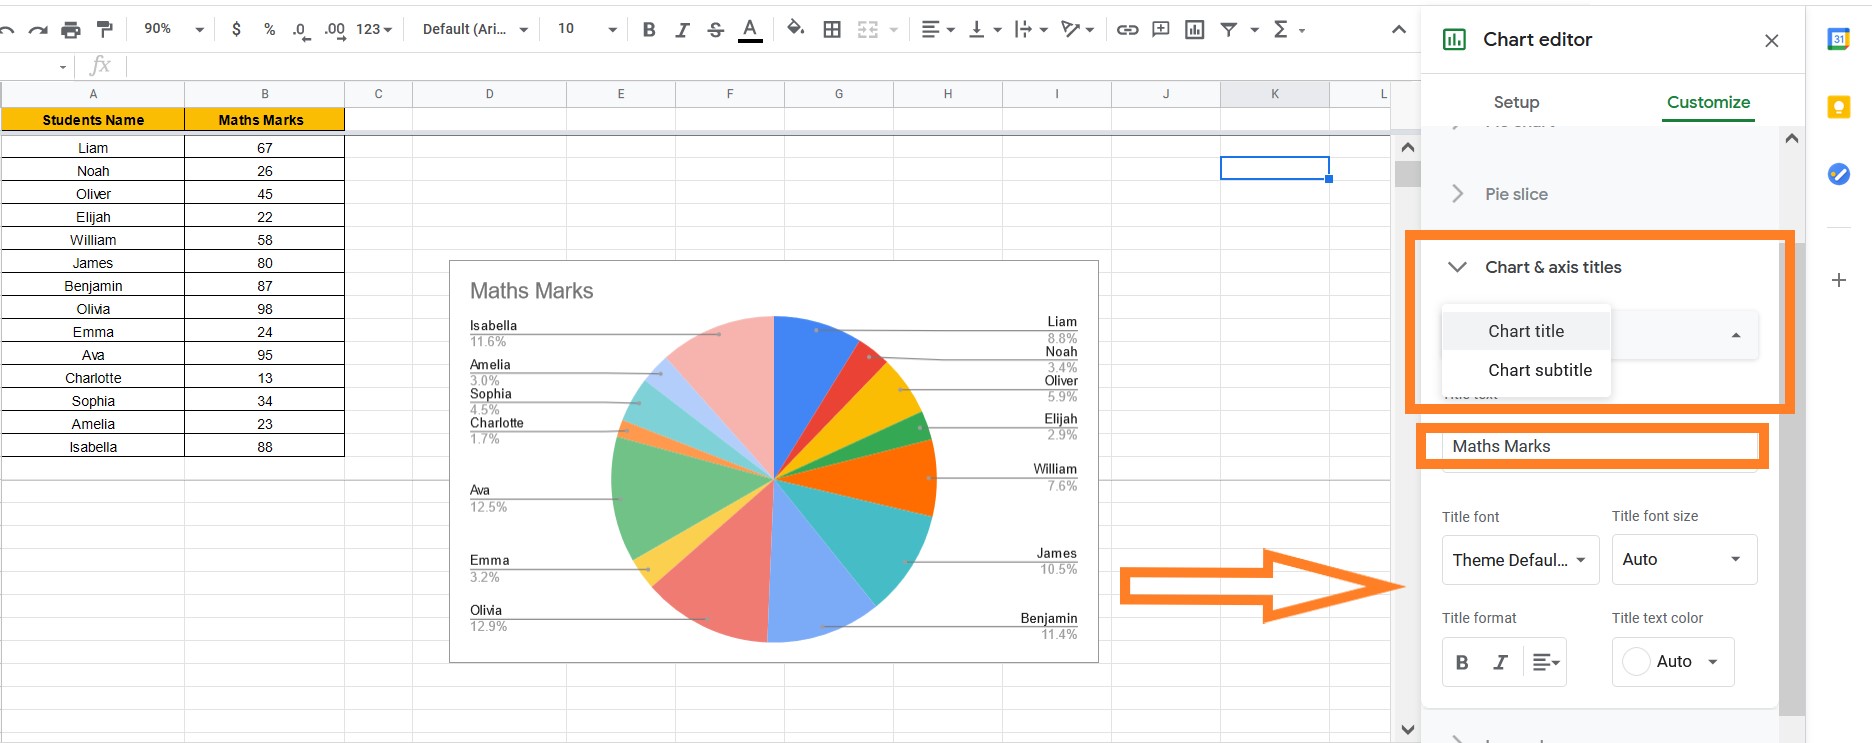
Step 5: Also you have the option to change the “Title font, Title font size, Title format, Title Text colour”. Customize the Pie chart title as per your requirements.
How to Make a 3D Pie Chart in Google Sheets?
To create a 3D chart, first, create a normal Pie Chart and then move to the Chart Editor tab and follow the steps listed below:
- Step 1: Move to the Chart Editor tab and place your cursor under the “Customize” window.
- Step 2: Now select the “Chart Style“.
- Step 3: Check the 3D option as shown in the image below.
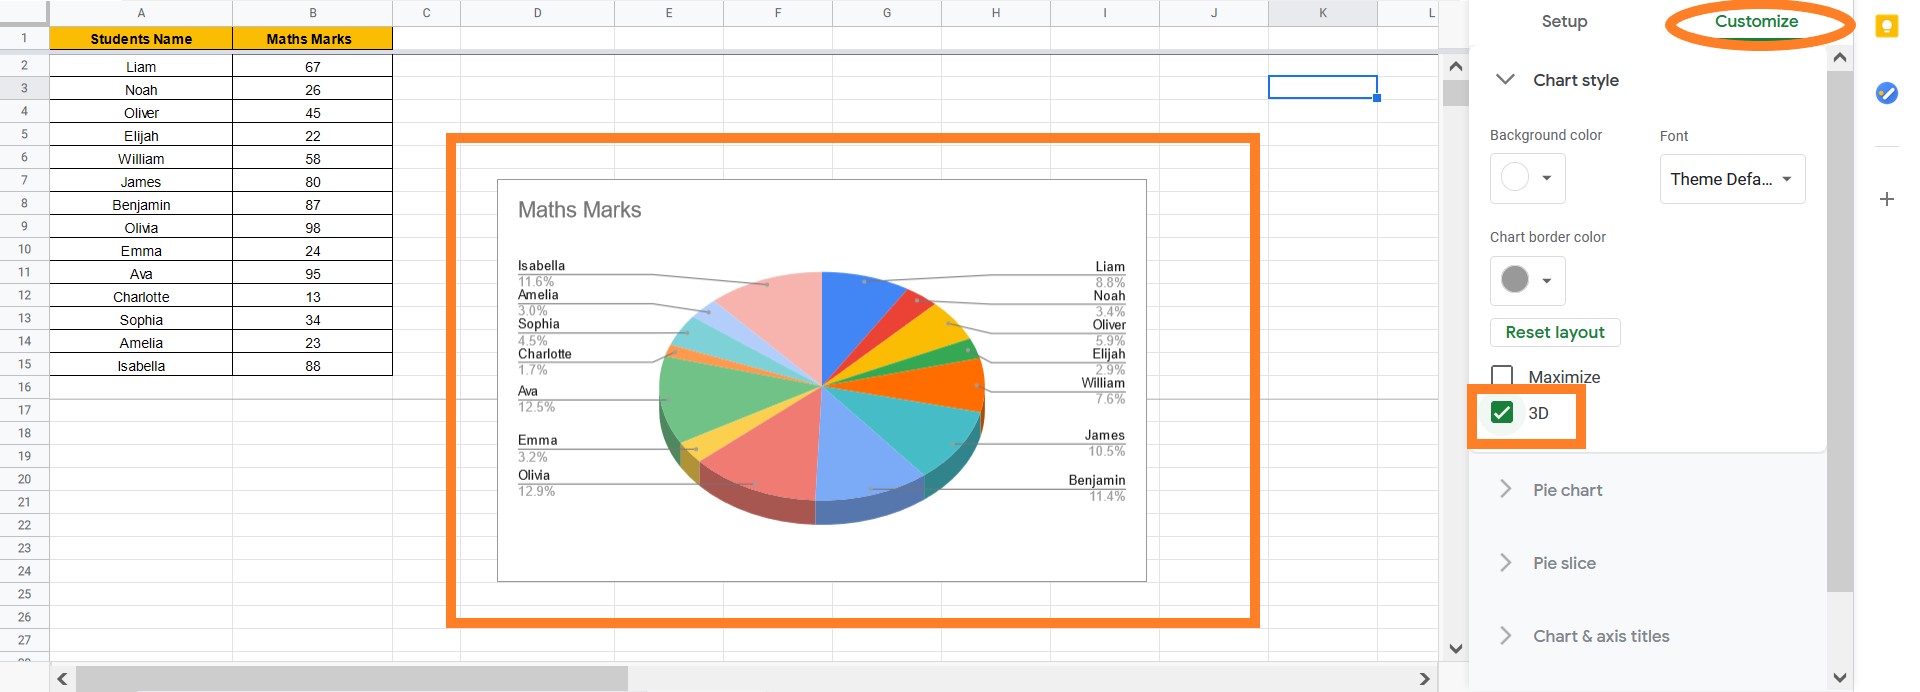
The Pie Chart will be converted into a 3D pie chart.
Also here you can customize your Pie chart by changing the background colour, Font, Chart border colour under the “Chart Size” option.
How to Change Pie Slices Color on Pie Chart?
Follow the steps listed below to change the Pie Slices colour on the Pie chart.
- Step 1: Click on the chart and move to the “Customize” window.
- Step 2: Now click on the “Pie Slice“.
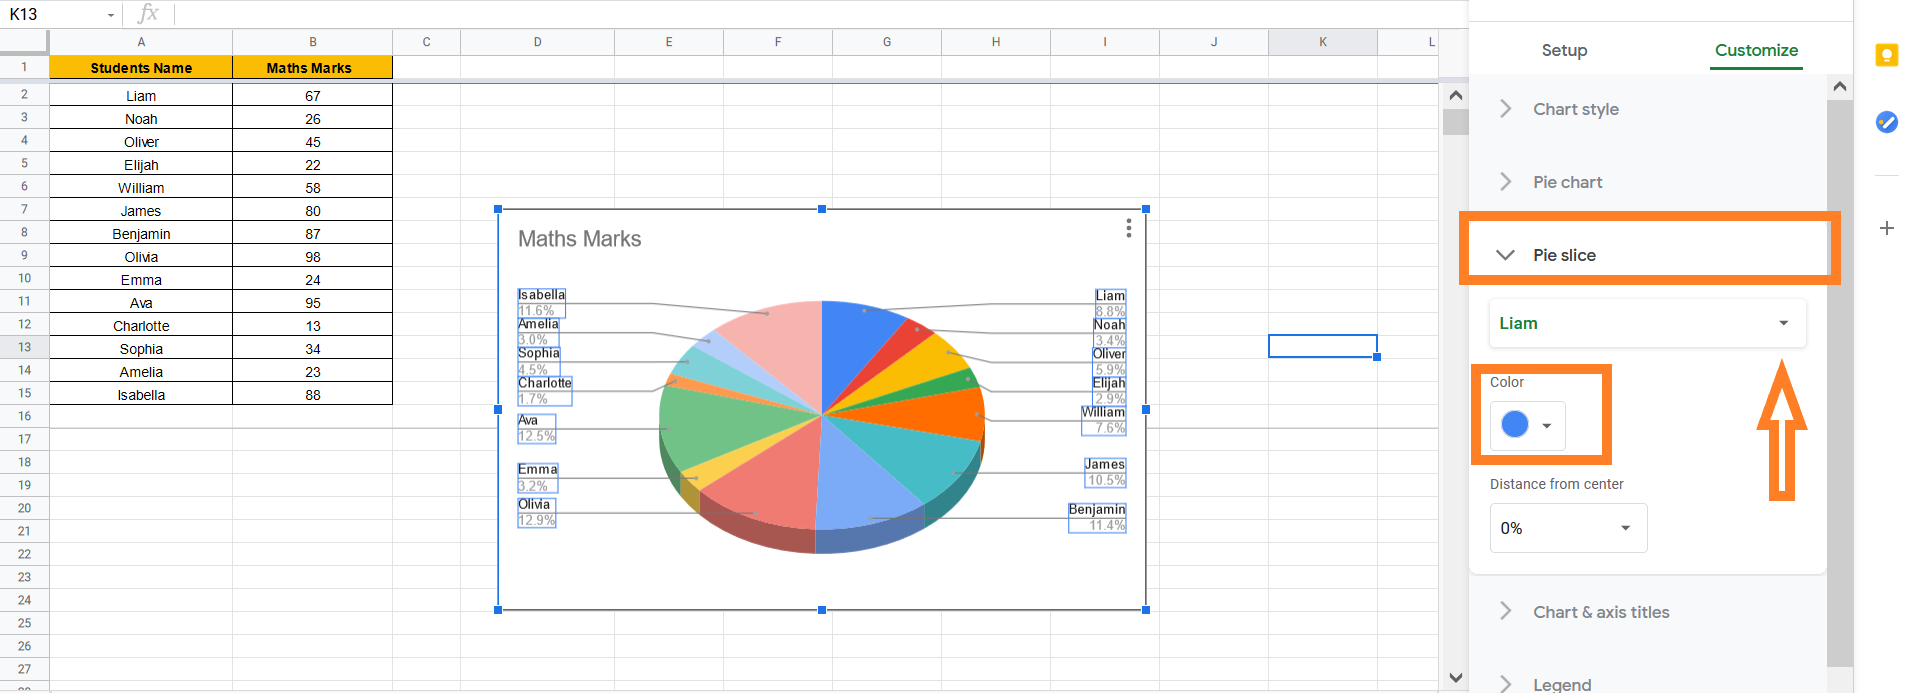
- Step 3: Now select under the tab “Pie Slice Selector” select the name.
- Step 4: As soon as you click on the “Pie Slice Selector” name, the colour palette shows up. Here you can change the colour as per the name.
How to Label a Pie Chart on Google Sheets?
Follow the steps listed below to label a pie chart in Google sheets:
- Step 1: Select the Pie chart, where you have to create a label.
- Step 2: Move to the “Customize” section.
- Step 3: Click on the “Pie Chart” option.
- Step 4: Move to the Slice Label section.
- Step 5: Select the Label and customize the label as shown in the image below.
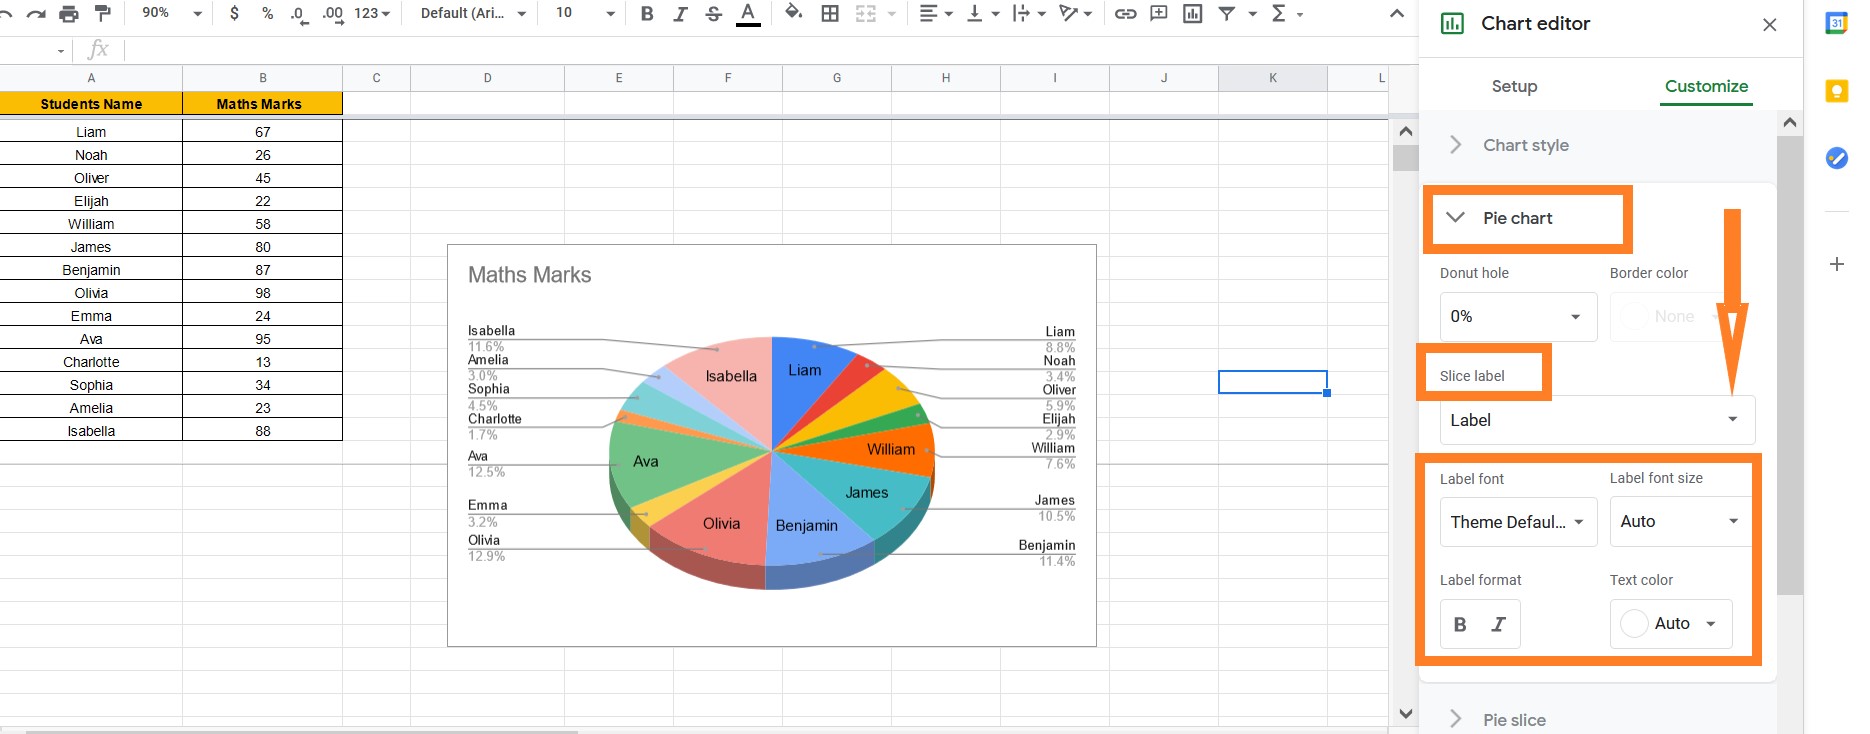
Note: You can customize your label font, font size, label format, text colour and so on.
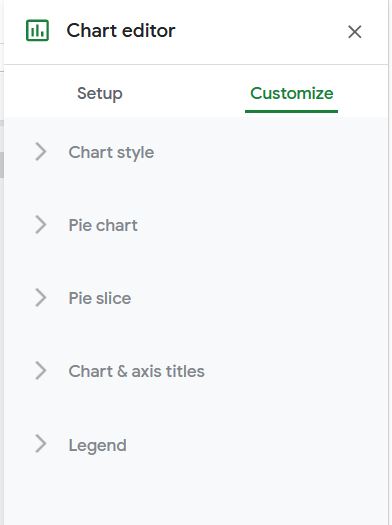
Important Tips & Tricks to Customize Pie Chart
- Chart Style: Change the appearance of the chart.
- Pie Chart: Add a slice label, a doughnut hole, or alter the border colour of the pie chart.
- Chart & axis title: Text in the title should be edited and formatted.
- Pie Slice: Change the colour of the pie slice or remove a piece from the middle.
- Legend: Change the position and content of the legend.